The Anthropocene as the age of the sixth mass extinction?
Biological systems
At the biological level, the Anthropocene is the story of a vertiginous fall: that of the life of "non-human" living beings. The lightning rise in human activity therefore goes hand by hand with a lightning fall of "non-human" living beings.
This asymmetry is very clear: human development takes place at the expense of everything that is not human, that is 99.99% of the life this planet shelters.
Since the start of the industrial revolution, the extinction rate of living species has increased alarmingly [1].
But the most striking and terrible fact is not so much in the disappearance of species as in the decline of animal populations. Thus, for the past fifty years, the number of individuals tends to collapse (with an average 69% decline in vertebrate population abundances) in studied animal populations [2, 3].
For arthropods, the most diversified branch of life and the one which contains the most individuals of the entire animal kingdom and even eukaryotes (80% of known species), some studies report a drop of more than 80% in number of individuals in a few decades [4, 5].
The cause of this sudden and massive "defaunation" is well known: human activity.
More specifically, the destruction of habitats (through the construction of infrastructures such as roads, deforestation for agriculture, etc.) is the main cause of biological collapse, far ahead of climate change [6].
Even if its contribution is still small, climate change is expected to considerably aggravate the already catastrophic situation of many living beings [7].
The various indicators available on "non-human" life are clear: it is more a question of life collapse or biological annihilation than of "biodiversity loss", an expression suggesting the anecdotal disappearance of a few species. Some no longer hesitate to speak of a sixth mass extinction [8, 9, 10]. In view of the unprecedented cause of this extinction, it would perhaps be more appropriate to speak of the first extermination of life on Earth...
Key messages


The analysis of the fossils preserved in these gigantic natural archives that are the sediments shows that life's history, some 3.7 billion years long, is made up of successive appearances (speciation) and disappearances (extinction) of species [11]. On average, the longevity of a species does not exceed a few million years. It is a relentless biological law: all species end up disappearing sooner or later.
In "normal" times, their is a background rate of species extinction, which does not exceed a certain level. It is estimated that about 10% of species become extinct every million years [12]. On the graph below, the rate of extinction is typically less than 5 families (in the classification of living beings, the family is a taxon that groups the genera, which themselves group the species) per million years. However, paleontology has shown that life's history was punctuated by singular events, during which a major part of life on Earth (at least 75% of species) goes extinct within a relatively (by geological standard) short period of time. These extraordinary events are called "mass extinctions".
The "big five" mass extinctions in Earth's history
The graph shows that to date, five events of mass extinctions have been recorded over the past 500 million years [13, 14], knowing that we have very little information on earlier times. These massive events are called the "Big Five". Some extinction events have been particularly impressive and nearly led to the outright disappearance of life on Earth. For example, the Permian-Triassic extinction (known as "The Great Dying") which occurred approximately 250 million years ago led to the disappearance of 96% of species on Earth! Source of the graph: modified from a figure in Our World In Data (https://ourworldindata.org/mass-extinctions).
Mass extinctions typically unfold in response to multiple, concurrent factors. The most frequently invoked causes are climatic (intense ice age), geological (strong volcanic activity, continental drift) or meteoritic (like the famous asteroid which crashed into the Gulf of Mexico 65 million years, and which would have contributed to erasing many species on Earth, including dinosaurs) [14].
In collective imagination, mass extinction may be perceived as something brutal. It is therefore important to specify that we are talking about a process that can extend over a few million years. Even the demise of the dinosaurs, often seen as an almost instantaneous event following a meteorite impact, may in fact have spanned millions of years [15].


Despite mass extinction events (symbolized by arrows in the graph to the left), the analysis of the diversity of life over time shows that life's history has a clear direction: diversification.
Diversification and extinction are tightly linked: recovery and diversification happened after every mass extinction. For example, the Cretaceous-Paleogene extinction, which notably killed off the dinasaurs, was followed by an important phase of speciation, with in particular the development of many mammal species.
Thus, in the 4.5 billion years of Earth's history, life has never taken such diverse forms as during the recent period [16]. It is estimated that almost nine million species currently coexist on Earth [11], but it could actually be ten times more [17]! And we are only talking here about eukaryotes; by including prokaryotes (bacteria and archaea), we rather arrive at estimates of the order of 1,000 billion species [18]!
The diversity represented on the graph (called the "Sepkoski curve", it was created by Jack Sepkoski from thousands of data sets from aound the world, and thus represents the work of hundreds of paleontologists) is in number of marine families, but the result would be different if the number of species was used instead, since mass extinctions have involved the disappearance of more than 75% of species.
The history of life has a direction: diversification
Source of the graph: modified from https://silurian-reef.fieldmuseum.org/narrative/474.


Nowadays, the rate of extinction of species is several hundred to several thousand times higher than the "normal" rate [1]. In total, about one million species are likely to disappear in the short term.
A quarter of animal and plant species encourage a high risk of extinction [1]. More than 40% of amphibian species, almost 33% of coral reefs and more than a third of all marine mammals are threatened. The situation is less clear for insect species, but the available data allow a provisional estimate of 10% endangered species.
It is well established that the rate of species extinction has accelerated alarmingly since the beginning of the industrial revolution, in line with the growth of human activity.
Of course, the figures related above are still very far from corresponding to a mass extinction. However, as discussed previously, a mass extinction is something that can take place over millions of years. There is no doubt that the continuation of current trends over a few thousand years will lead to a biological catastrophe of considerable magnitude. We are perhaps at the beginning of the sixth extinction of life on Earth and this one has a very singular cause: human activity.
On the road of the sixth extinction: generalized biodiversity loss
Source of the graph: IPBES [1].


While indicators are alarming about species extinction rate, they are critical concerning the evolution of the size of populations. Since 1900, the number of individuals of the different known species has decreased by at least 20% on average.
The situation is perhaps most critical for large animals. The Living Planet Index has tracked the populations of more than 30,000 species of mammals, birds, fish, reptiles and amphibians since 1970. The graph on the left thus shows the evolution of the size of the populations tracked relative to the 1970 benchmark. It reveals that between 1970 and 2018, the monitored populations of mammals, birds, amphibians, reptiles and fish have seen an average decline of 69%!
To learn more about the Living Planet Index, see the WWF Living Planet Report [2].
Source of data: Our World In Data [18].
On the road of the sixth extinction: the great defaunation
A recent study monitored the evolution of populations of more than 71,000 animal species covering the 5 groups of vertebrates (mammals, birds, amphibians, reptiles and fish) plus insects [3]. It clearly highlighted a widespread decline of life on Earth.
All groups combined and without taking into account species for which trends are unknown, 48% of the studied species are characterized by declining populations, 49% by stable populations and only 3% by expanding populations. This trend is detectable in each group, but is particularly marked for amphibians, birds and mammals.
It should be noted that for fish and insects, the trends remain unknown for a large part of the species. However, localized studies have shown impressive population declines, with for example in Germany up to 75 % decline in population abundances for insects and arthropods in a few years [4, 5].
Source of the graph: C. Finn, F. Grattarola, D. Pincheira-Donoso, Biological Reviews, 2023 [3].


Studies show that the decline of animal population is generalized, but that it is heterogeneous in space [2, 3].
The decline is strongest in places that have been relatively preserved until now, far from the so-called "developed" countries where elimination has already taken place for a long time. The most visible impacts are thus located in "developing" countries, i.e. in the areas with the greatest animal diversity: the tropics
For example, the living planet index shows that the decline is less pronounced in Europe and North America; on the other hand, the losses are abysmal in Southeast Asia, Africa and even more in Central and South America, where the average rate of decline reaches 94%.
Source of data: Our World in Data [19].
Out of Sight Out of Mind: where does the biological extinction take place?


The cause of the ongoing collapse of life is clearly identified: mankind and his way of inhabiting the world.
From the general cause of the disappearance of living beings, which we can call "human activity", we can isolate two more specific causes which constitute the main part of the destructive impact of humans on their environment: the destruction of habitats and the exploitation of living beings. At this stage, climate change, which completely obscures the biological crisis in the media, has not played a major role in the decline of life.
The destruction of habitats is done in particular by changing land surface, for example by razing a forest to do agriculture, by building infrastructures which fragment (roads, railways, etc.) or destroy (cities, commercial areas …) habitats, or by poisoning the soil, water and air.
As for the exploitation of living beings, the figures are dizzying. Every year and counting all species, more than 1,000 billion animals, including a large number of farm animals (we speak for example of 70 billion chickens), would be killed in the world for to be eaten by humans [20].
Source of the graph: WWF [21].
What are the drivers of current biological extinction? - Climate change is only the tip of the iceberg
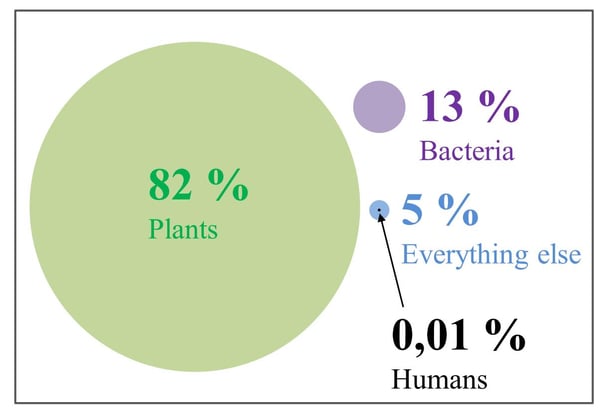

Humans represent only 0.01% of the whole terrestrial biomass…
First of all, if we look at the distribution of the global biomass, we see that humans represent only 0.01% of the Earth's biomass [22].
So it's clearly not by their weight in the original sense of the term that humans "dominate" living things.
But it's precisely the fact that this weight is so low that is intriguing: how can an animal with such a low weight (literally) in the living world have such a high weight (figuratively) on the Earth's surface and the life it supports? An obviously complex question, which was at the heart of my recently published book [23].
Beyond biological extinction - Human activity disrupts the composition of life
The influence of humans on the living world is not only reflected in the collapse of certain populations and an increase in the rate of species extinction. If we look at the distribution of biomass and its evolution, we can see that humans are simply changing the composition of life!
Source of the graph: modified from https://www.theguardian.com/environment/2018/may/21/human-race-just-001-of-all-life-but-has-destroyed-over-80-of-wild-mammals-study [24].
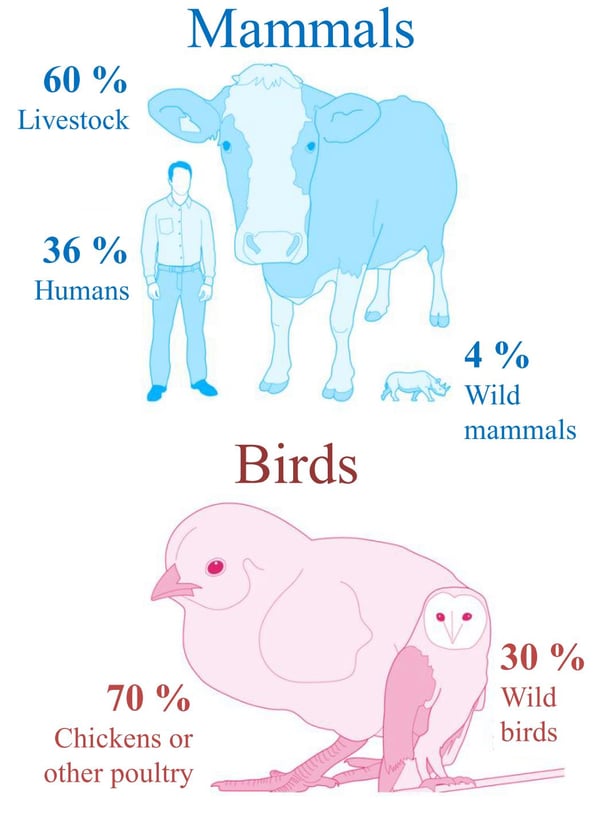
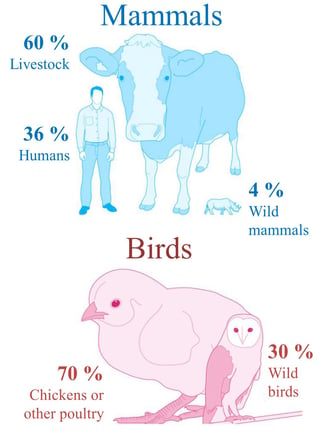
...but have a gigantic and growing weight in certain groups of living beings...
Our gigantic influence on the living world can be seen by focusing on more specific groups of living beings, in particular on the group to which we belong, the mammals. Today, it is estimated that the biomass of mammals is distributed as follows: 60% farmed animals, 36% humans and... 4% wild animals [22]. Put another way, humans and their "food" account for 96% of mammalian biomass! The remaining crumbs (the 4%) are all the other animals - thousands of species!
A similar observation is made for birds, whose biomass is 70% made up of poultry raised by humans and only 30% by wild birds [22].
The dynamics are also worth considering. Several thousand years ago, before the development of agriculture, the biomass of mammals and birds consisted almost exclusively of wild animals!
Two phenomena explain the incredible change in the composition of mammal and bird biomass: the meteoric rise in the number (and therefore biomass) of farmed animals [25] and humans [26], combined with the equally meteoric destruction of wild animals described above. While vertebrate populations have fallen by around 70% over the last fifty years, it is estimated that since the dawn of civilization, for example, the biomass of land mammals has fallen by over 80% [22].
Source of the graph: modified from https://www.theguardian.com/environment/2018/may/21/human-race-just-001-of-all-life-but-has-destroyed-over-80-of-wild-mammals-study [24].
In addition to population collapses, species loss and changes in biomass distribution, there is another marker of the considerable influence of humans on terrestrial life: over time, human activity has contributed to a decrease in the average size of certain mammals, particularly herbivores and carnivores.
There is in fact a U-shaped relationship between diet and organism size, with herbivores and carnivores tending to be larger than insectivores and omnivores [27]. By selectively eliminating herbivores (e.g. mammoth, megatherium and others in the past) and large carnivores (saber-toothed cats, cave lion...), humans tend to flatten the "U" and reduce the size differential between herbivores, carnivores, insectivores and omnivores.
Since the emergence of our species about 300,00 years ago, the average size of mammalian herbivores has thus decreased 100-fold and carnivores 10-fold [27]!
Ultimately, human activity has profound and deleterious repercussions on life: it causes the collapse of certain populations, to the point of eliminating entire species (which amounts to a "mutilation of the tree of life" [28]), but at the same time causes others (farm animals in particular) to explode, drastically altering the composition and structuring of living organisms, as well as the trajectory of their evolution on a global scale.

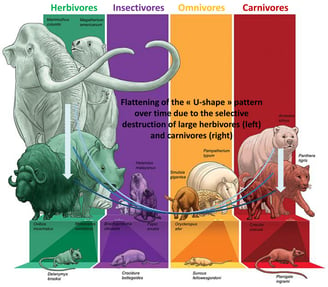
Source of the graph: modified from https://www.ceh.ac.uk/cutting-animals-down-size-could-backfire-humans [29].
References
[1] IPBES, « Global assessment report on biodiversity and ecosystem services of the Intergovernmental Science-Policy Platform on Biodiversity and Ecosystem Services. Bonn, Germany », IPBES secretariat, Bonn, Germany, 2019. [En ligne]. Disponible sur: https://zenodo.org/record/3553579
[2] WWF, « Living Planet Report − 2022: Building a nature-positive society. Gland, Suisse », WWF, Gland, Suisse, 2022. [En ligne]. Disponible sur: https://wwfint.awsassets.panda.org/downloads/embargo_13_10_2022_lpr_2022_full_report_single_page_1.pdf
[3] C. Finn, F. Grattarola, D. Pincheira-Donoso, « More losers than winners: investigating Anthropocene defaunation through the diversity of population trends », Biological Reviews, vol. 98, no 5, p. 1732-1748, 2023. https://onlinelibrary.wiley.com/doi/10.1111/brv.12974
[4] C. A. Hallmann et al., « More than 75 percent decline over 27 years in total flying insect biomass in protected areas », PLOS One, vol. 12, no 10, p. e0185809, 2017. https://doi.org/10.1371/journal.pone.0185809
[5] S. Seibold et al., « Arthropod decline in grasslands and forests is associated with landscape-level drivers », Nature, vol. 574, no 7780, 2019. https://www.nature.com/articles/s41586-019-1684-3
[6] WWF, « Living Planet Report − 2020: Bending the curve of biodiversity loss. Gland, Suisse », WWF, Gland, Suisse, 2020. [En ligne]. Disponible sur: https://www.worldwildlife.org/publications/living-planet-report-2020
[7] M. C. Urban, « Accelerating extinction risk from climate change », Science, vol. 348, no 6234, p. 571‑573, 2015. https://www.science.org/doi/10.1126/science.aaa4984
[8] G. Ceballos, P. R. Ehrlich, A. D. Barnosky, A. García, R. M. Pringle, et T. M. Palmer, « Accelerated modern human–induced species losses: Entering the sixth mass extinction », Sci. Adv., vol. 1, no 5, p. e1400253, 2015. https://www.science.org/doi/10.1126/sciadv.1400253
[9] G. Ceballos, P. R. Ehrlich, et P. H. Raven, « Vertebrates on the brink as indicators of biological annihilation and the sixth mass extinction », Proc. Natl. Acad. Sci., vol. 117, no 24, p. 13596-13602, 2020. https://www.pnas.org/doi/10.1073/pnas.1922686117
[10] R. H. Cowie, P. Bouchet, et B. Fontaine, « The Sixth Mass Extinction: fact, fiction or speculation? », Biol. Rev., vol. 97, no 2, p. 640‑663, 2022. https://onlinelibrary.wiley.com/doi/full/10.1111/brv.12816
[11] M. J. Benton, « Diversification and extinction in the history of life », Science, vol. 268, no 5207, p. 52‑58, 1995. https://www.science.org/doi/10.1126/science.7701342
[12] D. M. Raup, « A kill curve for Phanerozoic marine species », Paleobiology, vol. 17, no 1, p. 37‑48, 1991. https://www.jstor.org/stable/2400988
[13] D. M. Raup et J. J. Sepkoski, « Mass extinctions in the marine fossil record », Science, vol. 215, no 4539, p. 1501‑1503, 1982. https://www.science.org/doi/10.1126/science.215.4539.1501
[14] D. Jablonski, « Background and mass extinctions: the alternation of macroevolutionary regimes », Science, vol. 231, no 4734, p. 129‑133, 1986. https://www.science.org/doi/10.1126/science.231.4734.129
[15] M. Sakamoto, M. J. Benton, et C. Venditti, « Dinosaurs in decline tens of millions of years before their final extinction », Proc. Natl. Acad. Sci., vol. 113, no 18, p. 5036‑5040, 2016. https://www.pnas.org/doi/10.1073/pnas.1521478113
[16] C. Mora, D. P. Tittensor, S. Adl, A. G. Simpson, et B. Worm, « How many species are there on Earth and in the ocean? », PLOS Biol., vol. 9, no 8, p. e1001127, 2011. https://journals.plos.org/plosbiology/article?id=10.1371/journal.pbio.1001127
[17] M. S. Lee et P. M. Oliver, « Count cryptic species in biodiversity tally », Nature, vol. 534, no 7609, p. 621‑621, 2016. https://www.nature.com/articles/534621a
[18] K. J. Locey et J. T. Lennon, « Scaling laws predict global microbial diversity », Proc. Natl. Acad. Sci., vol. 113, no 21, p. 5970‑5975, mai 2016. https://www.pnas.org/doi/full/10.1073/pnas.1521291113
[19] H. Ritchie, F. Spooner, et M. Roser, « Biodiversity », Our World in Data, 2022. https://ourworldindata.org/biodiversity
[20] L214, « Dossier : les chiffres clés de la souffrance animale – Animaux abattus dans le monde », L214. https://www.l214.com/animaux/chiffres-cles/statistiques-nombre-animaux-abattus-monde-viande/
[21] WWF, « Living Planet Report − 2014: Species and spaces, people and places. Gland, Suisse », WWF, Gland, Suisse, 2014. [En ligne]. Disponible sur: http://assets.worldwildlife.org/publications/723/files/original/WWF-LPR2014-low_res.pdf?1413912230
[22] Y. M. Bar-On, R. Phillips, et R. Milo, « The biomass distribution on Earth », Proceedings of the National Academy of Sciences, vol. 115, no 25, p. 6506‑6511, 2018. https://www.pnas.org/doi/10.1073/pnas.1711842115
[23] H. Cuny, Le bon, la brute et le tyran - Ce que l’Anthropocène dit de nous. Maïa, 2023.
[24] D. Carrington, « Humans just 0.01% of all life but have destroyed 83% of wild mammals – study », The Guardian. 2018. https://www.theguardian.com/environment/2018/may/21/human-race-just-001-of-all-life-but-has-destroyed-over-80-of-wild-mammals-study
[25] H. Ritchie, P. Rosado, et M. Roser, « Meat and Dairy Production », Our World in Data, 2023. https://ourworldindata.org/meat-production
[26] H. Ritchie et al., « Population Growth », Our World in Data, 2023. https://ourworldindata.org/population-growth
[27] R. Cooke et al., « Anthropogenic disruptions to longstanding patterns of trophic-size structure in vertebrates », Nat Ecol Evol, vol. 6, no 6, p. 684‑692, 2022. https://www.nature.com/articles/s41559-022-01726-x
[28] G. Ceballos et P. R. Ehrlich, « Mutilation of the tree of life via mass extinction of animal genera », Proceedings of the National Academy of Sciences, vol. 120, no 39, p. e2306987120, 2023. https://www.pnas.org/doi/full/10.1073/pnas.2306987120
[29] UK Centre for Ecology & Hydrology, « Cutting animals down to size could backfire on humans ». 2022. https://www.ceh.ac.uk/cutting-animals-down-size-could-backfire-humans