


The Anthropocene as the age of big data
Information and communication technologies
The generalization of information and communication technologies (ICT) is another recent revolution which contributes to increase human activity as well as its impact on Earth's surface.
While modern transport modes have accelerated and densified the flow of goods and people, ICT have developed the volume and flow of data in an extraordinary way.
In opposition to what is usually said, ICT are in no way "dematerialized", but are based on massive and energy-intensive infrastructures.
Like modern transport or urbanization, ICT therefore involves the extraction and transformation of large quantities of natural resources, whether for the manufacture of equipments (terminals, network cables, servers, etc.) or for their operation (data transfer, server cooling, etc.).
The number of digital devices is increasing dramatically: in 2019, there were more than 30 billion digital devices in the world [1], largely concentrated in so-called developed countries [1, 2]. By contrast, there were 1 billion connected objects in 2010.
The manufacture of digital devices involves the extraction of dozens of metals around the world and significant energy consumption, with therefore strong impacts on natural environments [3].
The use of digital devices also has very real impacts: it is estimated that it represents 55% of the sector's energy consumption, compared to 45% for the manufacture of devices [2].
Usage is growing exponentially: the volume of data doubles every 2 or 3 years [4], while data traffic increases by 25% per year [2].
The increase in data traffic is largely due to video, which in 2018 accounted for 80% of global data flows and 80% of the increase in their annual volume [5].
In connection with the incredible increase in the volume and flow of data, the energy consumption of the digital sector increases by 9% each year [2].
As the digital sector consumes more and more energy, it emits increasing amounts of greenhouse gases. In 2018, digital represented 4% of global greenhouse gas emissions, compared to 2.5% in 2013 [2]. Forecasts expect at least 5% in 2025 [1].
A fundamental aspect of digital is the total decoupling that takes place there between causes (the use of digital functionalities) and consequences (energy consumption and environmental degradation). Much more than the era of dematerialization, digital is the era of a complete disconnection between our behaviors and their consequences.
Key messages
ICT relies on materials and energy


While the sharing of information has for a long time been constrained in space and time, now two people located in two opposite points of the Earth can come into contact immediately and at any time thanks to computers.
However, ICT are not immaterial, but rely on infrastructure that consume large quantities of resources for their manufacture and operation. The ICT sector therefore also strongly depends on the abundant and cheap energy obtained by the extraction and transformation of fossil resources.
The growth in the number of digital devices is impressive: while the number of connected objects was 1 billion in 2010, in 2019 it was estimated that there were 34 billion digital devices for 4.1 billion users, i.e. 8 devices per user on average [1]. However, this average equipment rate hides very large geographical disparities. On average in 2018, an American had nearly 10 connected digital devices where an Indian had only one [2].
A device like a computer contains dozens of metals mined, whose extraction all around the world causes profound damage to the environment [3]. The manufacture of equipment also requires significant energy consumption and the emission of greenhouse gases.
However, it is the use of digital devices that contributes the most to the sector's energy consumption. Indeed, each byte transferred or stored requires energy-intensive terminals and devices (data centers, networks, etc.). The use of digital would be responsible for 55% of the energy consumption of the sector, against 45% for the production of equipment [2].
The growth in digital use is gigantic.. The volume of data doubles every 2 or 3 years [4], while data traffic increases by 25% per year [2]. This increase in data traffic is mainly driven by video streams, which accounted for 80% of global data streams in 2018 and 80% of their annual volume increase [4]. In the same way that digital equipment is concentrated in rich countries, data consumption is very unequal: in 2018, an American consumed 70 times more digital data than an Indian (140 Gigabytes per month against 2 Gigabytes) [2].
In connection with the massive increase of data volume and flows, the energy consumption of the digital sector increases by 9% every year [2]. As a result, the digital contribution to greenhouse gas emissions is increasing sharply. In 2013, digital represented 2.5% of global greenhouse gas emissions [2]. In 2018, it was 4%, more than air transport, yet widely singled out [1, 2]. In 2025, it could be 5% [1].
Source of images: Pixabay.
ICT or the era of the disconnection between causes and consequences

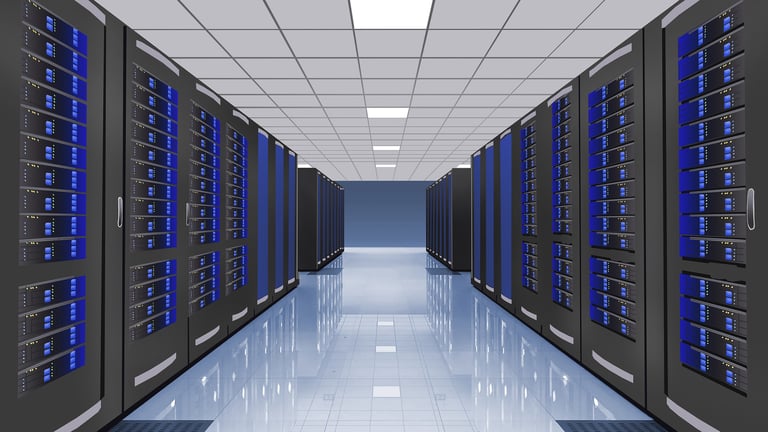
Data centers constitute essential infrastructure of the ICT system. These are physical locations that include all the facilities (servers in particular) in which data are stored and processed. They are either hosted within the companies themselves, or outsourced in huge warehouses. Their objective is to ensure the permanent availability of data, while guaranteeing a high level of security. To meet the needs, their number is growing continuously.
At the beginning of 2023, there were about 8,000 in the world, of which about a third in the United States [6, 7]. Data center must be constantly supplied with electricity. To operate of course, but also to be cooled since the facilities of a center produce a lot of heat.
In 2022, data centers would have consumed between 240 and 340 terawatt-hours (TWh) of electricity, a consumption which increases by 20 to 40% each year and which today represents between 1 and 1.5% of global electricity consumption [8]. This estimate excludes energy used for cryptocurrency mining, which was estimated to be around 110 TWh in 2022, or 0.4% of global electricity consumption.
Since they consume energy, data centers contribute to greenhouse gas (GHG) emissions. In 2020, they emitted around 330 million tonnes of CO2, accounting for 0.9% of energy-related GHG emissions or 0.6% of total GHG emissions [8].
Data centers, which concentrate massive infrastructures and a significant consumption of energy out of sight, can be linked to a fundamental aspect of digital technology: the decoupling between causes and consequences. Operations which have become distressingly commonplace for us, such as sending an e-mail or making a request with a search engine, involve data flows (and therefore energy consumption) between several centers which may be at the antipodes.
It is estimated that digital data such as an e-mail cover an average of 15,000 km [9]. Sending an e-mail, doing any Internet request, or sharing a video of lovely kittens via the Internet therefore induces energy consumption for the transfer of data as well as for their storage in a data center. Put another way, a simple click in my neat living room can generate environmental degradation that is in no way virtual.
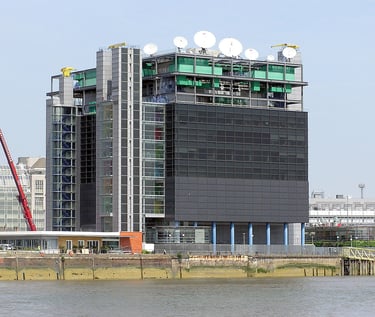
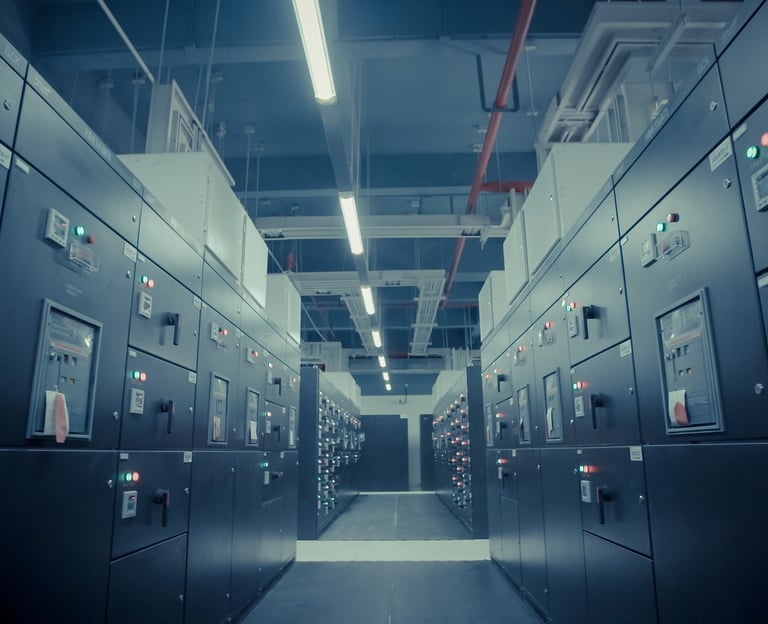
Images: data center of Reuters agency in London (top image) and a data center seen from inside (bottom image).
Sources of images: Wikipedia (Arpingstone, Public domain, via Wikimedia Commons) for top image, Pixabay for bottom image.

References
[1] GreenIT, « Empreinte environnementale du numérique mondial », 2019. https://www.greenit.fr/etude-empreinte-environnementale-du-numerique-mondial/
[2] The Shift Project, « Pour une sobriété numérique », 2018. [En ligne]. Disponible sur: https://theshiftproject.org/article/pour-une-sobriete-numerique-rapport-shift/
[3] France Stratégie, « La consommation des métaux du numériques : un secteur loin d’être dématérialisée », 2020 [En ligne]. Disponible sur: https://www.strategie.gouv.fr/sites/strategie.gouv.fr/files/atoms/files/fs-2020-dt-consommation-metaux-du-numerique-juin.pdf
[4] Statista, « Volume of data/information created, captured, copied, and consumed worldwide from 2010 to 2020, with forecasts from 2021 to 2025 », Statista, 2022. https://www.statista.com/statistics/871513/worldwide-data-created/
[5] The Shift Project, « Climat : l’insoutenable usage de la vidéo en ligne – Un cas pratique pour la sobriété numérique – Résumé aux décideurs », juill. 2019. [En ligne]. Disponible sur: https://theshiftproject.org/article/climat-insoutenable-usage-video/
[6] Techjury, « 15 Crucial Data Center Statistics to Know in 2023 », Techjury, 2023. https://techjury.net/blog/data-center-statistics/
[7] Statista, « Number of data centers worldwide in 2022, by country », Statista. https://www.statista.com/statistics/1228433/data-centers-worldwide-by-country/
[8] IEA, « Data Centres and Data Transmission Networks », IEA, 2023. https://www.iea.org/energy-system/buildings/data-centres-and-data-transmission-networks
[9] ADEME, « La face cachée du numérique », ADEME, 2019. https://librairie.ademe.fr/cadic/2351/guide-pratique-face-cachee-numerique.pdf