

The Anthropocene as the age of human-induced climate change
Climate change
At the level of physical systems and as for human systems, the history of the Anthropocene is often that of a lightning rise.
This is logical: human activity converts natural resources into goods and services. This conversion is accompanied by the production of waste, which accumulates in the biosphere. The striking growth of human activity therefore goes hand by hand with an equally striking increase in the presence of certain compounds in the biosphere.
This increase is particularly impressive for the concentration of greenhouse gases in the atmosphere.
Atmospheric CO2 concentration has increased by 50% in 200 years, from 280 ppm in 1800 to 417 ppm in 2022 [1].
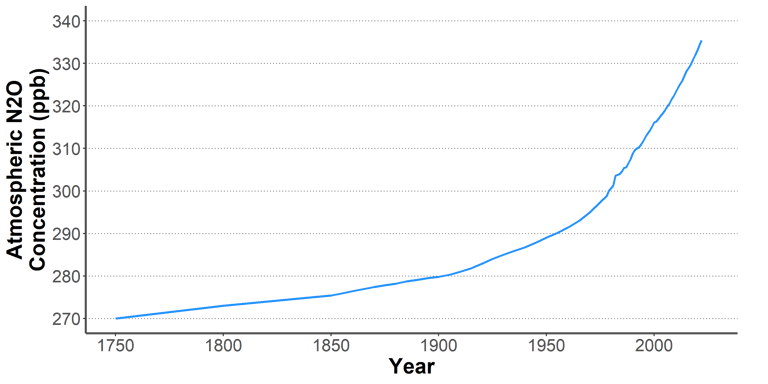
At the same time, the atmospheric concentration of methane doubled, while that of nitrous oxide increased by 25% [1].
As the concentration of greenhouse gases increases, so does the temperature of the Earth's surface and the level of the oceans.
Since 1850, the global temperature has increased by 1.5°C [1], constituting a brutal break with the climate of the last millennia [2, 3]. As the increase is greater inland than above the oceans, warming has already reached 2-3°C in many habitable areas around the world [4, 5].
Without a major change in the trajectory of greenhouse gas emissions, the rise in global temperature could reach 3 to 4°C by the end of the century [3].
For its part, the level of the oceans has risen by more than 20 cm, with an accelerating rate of rise [6].
The uniqueness of the current climate change lies in its origin and its temporality: it results from human activity and it is extraordinary rapid. This is probably the first time in the billions of years of Earth and life's history that a single species influences the climate system to such an extent and with such suddenness.
Key messages
The analysis of past climates is crucial to understand climate functionning. As we have direct records of climate variables only for a few decades, past climates must be reconstructed from indirect indicators. The latter, called proxies, are natural elements sensitive to climatic variations and whose a posteriori analysis can thus provide information on past climatic conditions. For example, tree rings (for the last thousand years), ice sheets (for the last 800,000 years) or marine sedimentary layers (for the last million years) are particularly analyzed to reconstruct past temperatures.
Change is a climatic constant: illustration with 500 million years of Earth's climate history

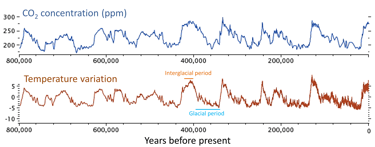
The analysis of Antarctic ice, which are 800,000 years old, makes it possible to reconstruct the joint changes in CO2 concentration and temperature over the last 800,000 years. It thus reveals an alternation of cold periods, called glacial periods, and warmer periods, called interglacial periods. The last glacial period ended around 12,000 years ago, with a gradual rise in temperatures following the reaching of the last glacial maximum around 20,000 years ago. The relatively stable temperature known for just over 10,000 years would have largely contributed to the emergence and development of civilization as we know it today. The graph stops around 1900 and does not show the staggering recent increase in CO2 concentration and global temperature, which we will discuss below. Source of the graph: NASA (https://earthobservatory.nasa.gov/features/CarbonCycle/page4.php).
The alternation between glacial and interglacial periods is generally explained by the Milankovitch theory, which states that cyclical changes in Earth's orbital parameters (eccentricity, obliquity and precession) occur under the action of large planets and influence the amount of energy received by the Earth, to ultimately modify its climate [7].
However, changes in Earth's orbit alone are not enough to explain the magnitude of temperature variations. For this, a second key factor then comes into play: GHGs and their concentration in the atmosphere. If its warming potential is not the most important, CO2 has been pointed out as a major driver of past climate changes. Thus, over the last 800,000 years, the concentration of atmospheric CO2 has evolved in close relation with the global temperature.
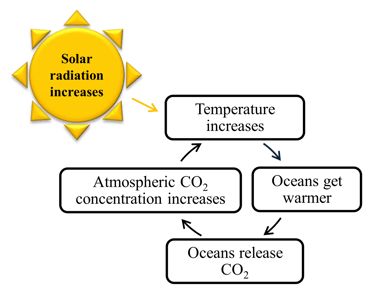
CO2 has therefore generally not been the trigger, but an amplifier of climatic variations, by intervening in positive feedback loops. Here is an example of a positive feedback loop: due to tiny changes in orbital parameters, the amount of solar radiation received by the Earth increases slightly, which contributes to raising the temperature. Since CO2 is less soluble in warm water than in cold water, oceans release more CO2. The atmospheric CO2 content increases, which accentuates the greenhouse effect and amplifies the warming of the Earth.
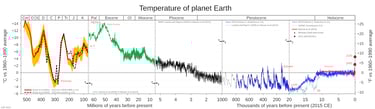
These analyzes have shown that the global temperature has varied considerably in the past. Between 60 and 40 million years before our era, the global temperature was perhaps around ten degrees or more higher than the current temperature! Since then, the underlying trend has been towards a gradual cooling of the Earth's surface. This long-term evolution is interspersed with higher frequency oscillations, with alternating drops and rises in global temperature on scales of the order of a few thousand years. Three major factors have been identified for their involvement in these past changes: the amount of solar energy received, volcanic activity and the atmospheric concentration of greenhouse gases (GHGs). Please note that the abscissa scale of the graph is not linear, which can be misleading, especially with regard to the relative climatic stability of the last millennia, the latter in fact constituting only a spark in the history of the Earth. Source of the graphic: Glen Fergus, CC BY-SA 3.0 <https://creativecommons.org/licenses/by-sa/3.0>, via Wikimedia Commons (https://upload.wikimedia.org/wikipedia/commons/5/5f/All_palaeotemps.svg).


Ultimately, the analysis of the past shows that climate change is no exception to an iron law of the universe: change. It also highlights a fundamental property of the climate system: its sensitivity, which means that even a small variation in a climatic parameter can lead to considerable variations in the climate and in particular in global temperature.
Today, humans are triggering not a small but a gigantic variation in a climatic parameter: the concentration of greenhouse gases (GHGs) in the atmosphere. Thus, the evolution of the concentration of GHGs in the atmosphere is one of the most spectacular manifestations of the Anthropocene.
Since the industrial revolution, humans have released huge amounts of GHGs into the air, in particular CO2. Over the past ten years, human activity has emitted into the atmosphere between 35 and 40 billion tonnes of CO2 per year, and each year beats the record of the previous one.
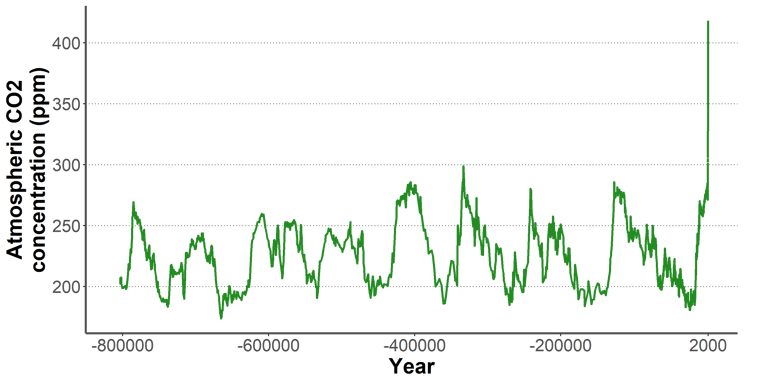
This reckless release of GHGs has logically contributed to drastically increasing their concentration in the atmosphere, as evidenced by the staggering recent evolution of the atmospheric CO2 concentration. On the scale of geological time, the increase in atmospheric CO2 driven by humans appears instantaneous and of an incredible amplitude (top graph)!
In 2022, the atmospheric CO2 concentration thus reached 417 ppm (parts per million – the gas concentration in the atmosphere is expressed in parts per million, which amounts to milliliters per cubic meter). This represents an increase of almost 50% in 200 years, that is to say since the beginning of the industrial revolution when the CO2 concentration was around 280 ppm.
The atmospheric CO2 ceoncentration is known for the past 800,000 years, the period covered by the data from ice cores. During this period, the CO2 concentration never exceeded 300 ppm. And several clues suggest that the current concentration of CO2 has not been reached in the last three million years.
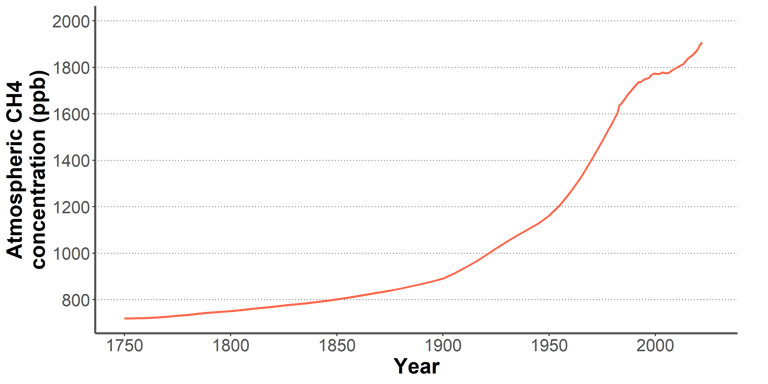
Similarly, the atmospheric concentration of methane has more than doubled since the beginning of the industrial era (middle graph), while the concentration of nitrous oxide has increased by nearly 25% (bottom graph).
Source of data: Our World In Data [1].
Humans are changing the composition of the atmosphere: greenhouse gases at an unprecedented level for thousands of years
This staggering increase in certain GHGs in the atmosphere has already gone hand in hand with a brutal global warming. Unlike past climate changes, in which GHGs have rather been amplifiers of temperature variations, current climate change is therefore triggered by GHGs.
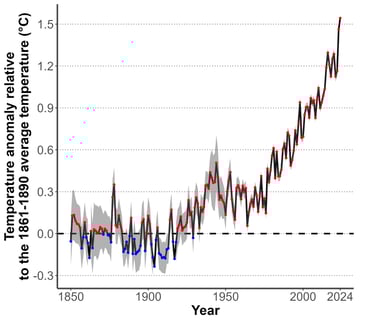
Looking at the evolution of the average global temperature since 1850 relative to the average global temperature for the period 1961-1990, we see that the temperature has increased very sharply in recent decades. It is now about 0.8°C higher than the 1961-1990 reference. Conversely, the temperature at the start of the industrial era was about 0.4°C lower than the 1961-1990 reference. The difference between the pre-industrial period and the current period is therefore approximately 1.2°C.
A warming of the average global temperature of 1.2°C in less than two centuries is a warming of extraordinary suddenness! By comparison, over the past few million years, when the Earth emerged from glacial periods, the global temperature increased by 4 to 7°C over periods of the order of 5,000 years. The warming of about 1°C during the last century is therefore about 10 times faster than postglacial warming.
Finally, current climate change has two singularities that distinguish it from past changes: it is triggered by GHGs emitted by humans and is taking place with extraordinary suddenness.
Humans are changing the Earth's climate: a sharp rise in global temperature due to human activity

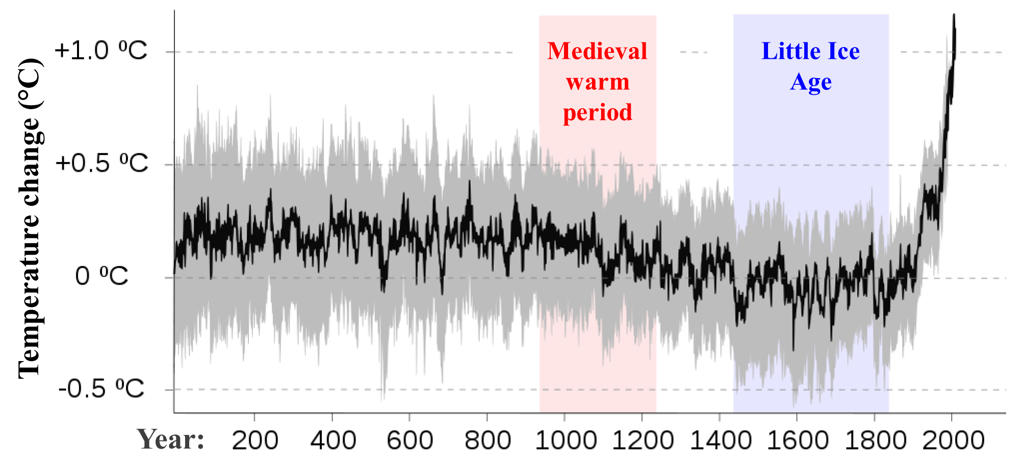
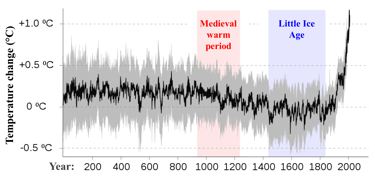
Reading the information recorded by tree rings makes it possible to reconstruct the evolution of the global average temperature over the last 2 millennia. The graph above thus shows 2,000 years of temperature evolution relative to the average temperature of the period 1850-1900. Despite constant temperature variations in the past, such as the well-known Medieval Warm Period (10th to 14th century) and Little Ice Age (14th to 19th century), which were restricted to North Atlantic regions, no global change has occurred with the amplitude and in the time laps that characterize recent warming. In the last 2,000 years (and probably more), it has never been as warm as it is today on a global scale [2]. This graph is referred to as the "hockey stick graph" because of the sudden rise in global temperature over the last century, which is a real break with the climate of the last millennia. Source of the chart: RCraig09, CC BY-SA 4.0 <https://creativecommons.org/licenses/by-sa/4.0>, via Wikimedia Commons.
Source of data: Our World In Data [1].
A sharp rise in global temperature, unprecedented for several thousand years
Proof of the human origin of climate change

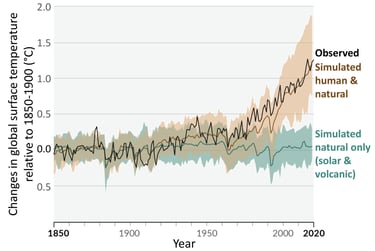
As we saw above, the concentration of greenhouse gases in the atmosphere is not the only factor influencing the Earth's climate.
There is, however, formal proof that it is indeed the determining factor in current climate change. Models that do not take this factor into account are able to reconstruct past temperature trends fairly well, but are totally unable to simulate the sudden and recent rise in temperature. This means that variations in natural factors alone (solar activity, volcanic activity, etc.) are unable to explain the rise in temperatures since 1850.
Conversely, the inclusion of human factors enables us to reproduce the recent trend, which means that it is indeed the rise in atmospheric GHG content due to human activity that is the cause of the current warming.
Graph source: Modified from figure SPM.1 in IPCC Sixth Assessment Report [3].
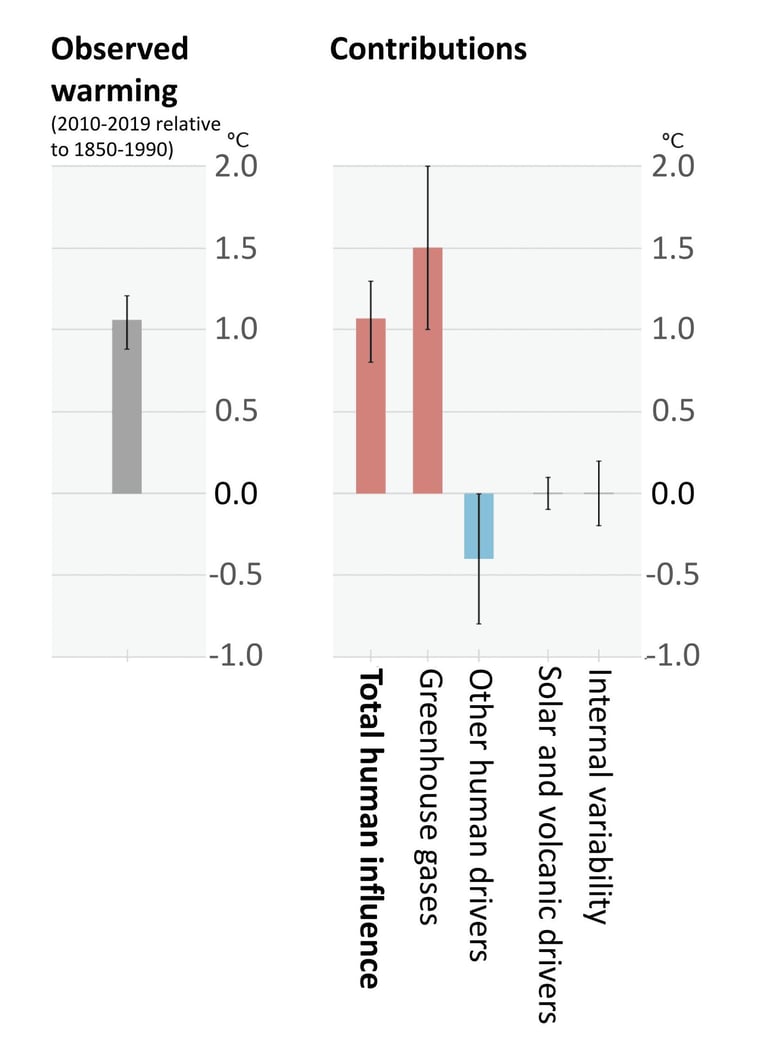

It is possible to assess the contribution of various parameters to the warming observed over the recent period. The various greenhouse gases (carbon dioxide, methane and nitrous oxide in particular) appear to be the main contributors to global warming.
Other factors linked to human activity have a negative effect (e.g. sulphur dioxide emissions, which tend to have a cooling effect) that somewhat offsets the positive effect of greenhouse gases, but the overall effect of human activities remains largely positive on global temperature.
Solar and volcanic activity influence global temperature, but have no effect on current warming.
Graph source: Modified from figure SPM.2 in IPCC Sixth Assessment Report [3].
What does +1.5°C global warming mean? - Climate change varies widely around the globe
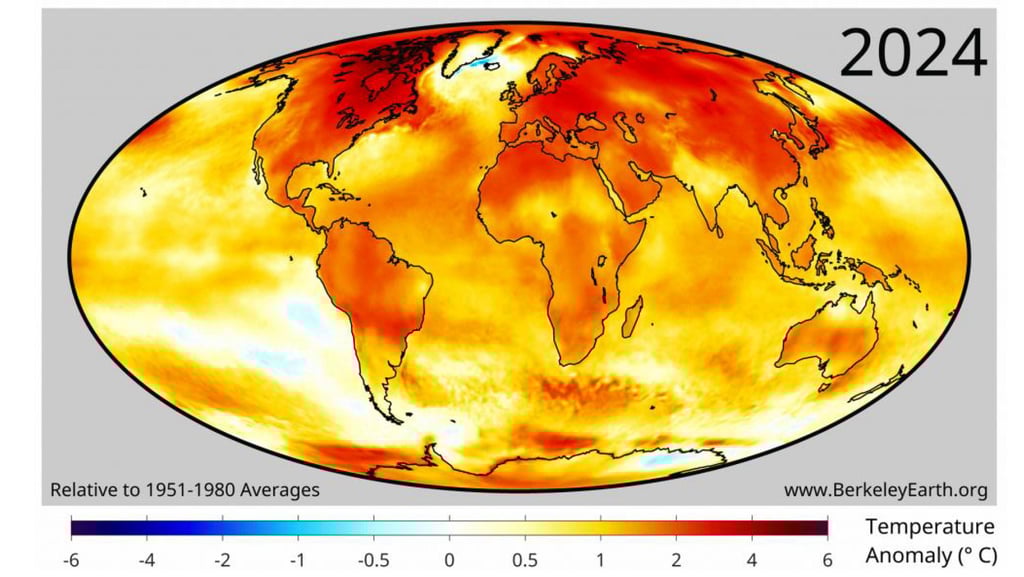

Spatialization of temperature changes shows that global warming is highly variable in space.
Two salient facts can be reported: 1) warming is much stronger inland than over the oceans, notably due to the buffering effect of the oceans; and 2) warming is particularly strong at high latitudes in the northern hemisphere, notably in the Arctic.
To say that global temperatures have risen by an average of 1.5°C says little about climate change in any given place. In Europe, for example, temperatures are already tending to be 2 to 3°C higher than in the period 1851-1900 [5]!
Graph source: Berkeley Earth [4].

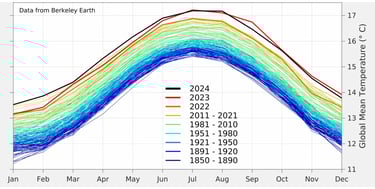
Another way of observing global warming is to look at the Earth's monthly temperature curve. It's easy to see that the most recent periods and years tend to occupy the upper part of the graph: warming is significant and concerns the entire seasonal cycle. Graph source: Berkely Earth [4].
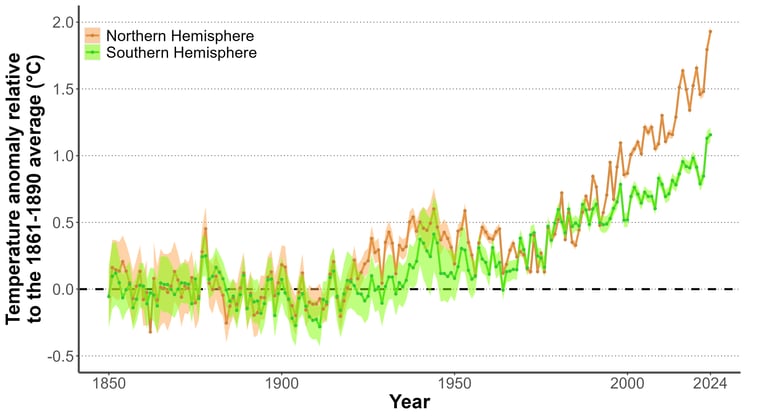
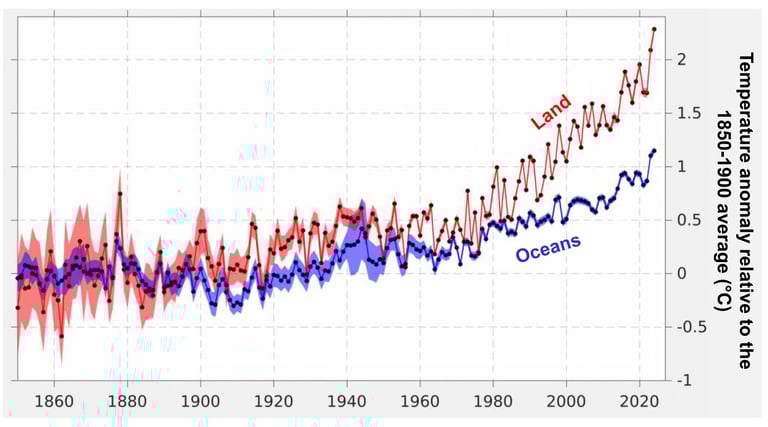
The trends described above can be seen in these graphs: compared with the pre-industrial era, temperatures have already risen by more than 2°C on average over land, compared with 1°C over the oceans. The Northern Hemisphere, which contains around two-thirds of the world's landmass, has warmed by just under 2°C, compared with "only" a little over 1°C for the Southern Hemisphere.
Source for top graph: Berkeley Earth [4].
Data source for bottom graph: Our World In Data [1].

What future for climate change?
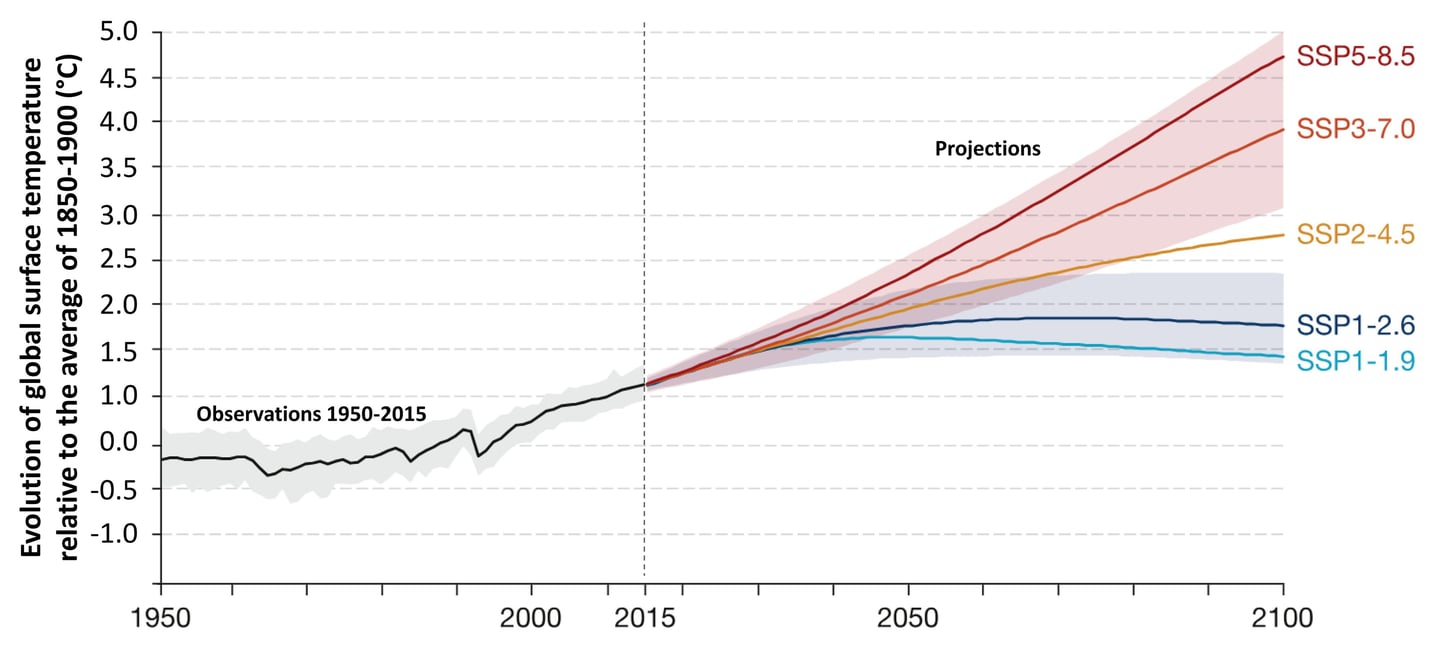
Projecting the future climate remains a difficult exercise, given the complexity of the climate and the intrinsically uncertain nature of the future. However, it is almost certain that the global temperature of the Earth's surface will continue to rise in the years to come. This is largely due to the long residence times of greenhouse gases in the atmosphere (CO2, in particular, has a very long residence time). The extent of the increase is more uncertain and will depend on many factors, but first and foremost on the level of human emissions of greenhouse gases and the capacity of natural "carbon sinks" (oceans and forests in particular) to absorb carbon. To take account of these uncertainties and simulate a wide range of possibilities, the Intergovernmental Panel on Climate Change (IPCC) produces projections based on a multitude of scenarios and models. In the most optimistic scenarios, with a massive drop in human CO2 emissions in future years (e.g. in the SSP1-1.9 family of scenarios, in which emissions become zero around 2050), warming is contained to a temperature of around 1.5°C above pre-industrial levels. In the most pessimistic scenarios, with a massive increase in human CO2 emissions in future years (e.g. in the SSP5-8.5 family of scenarios), warming could exceed 4°C by 2100! Chart source: French Ministry of Ecology (https://www.statistiques.developpement-durable.gouv.fr/edition-numerique/chiffres-cles-du-climat/fr/4-scenarios-et-projections-climatiques), from IPCC (Working Group 1, 2021).
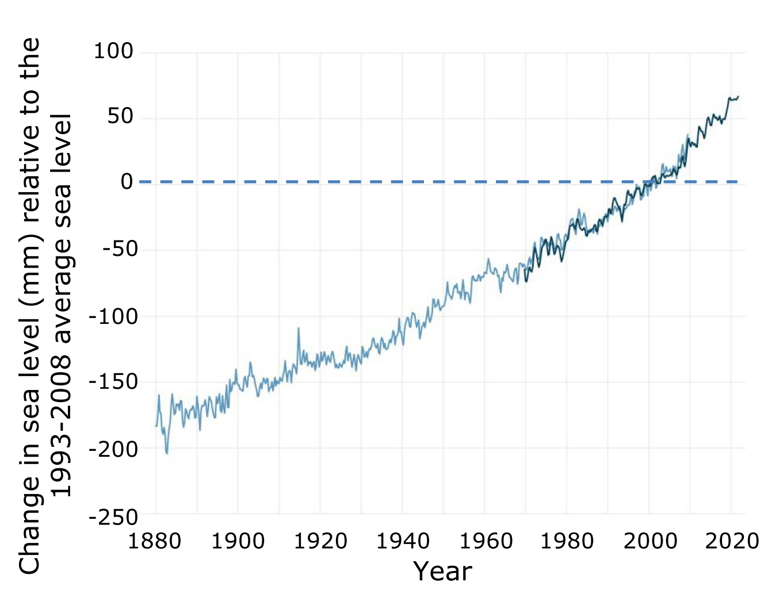
Who says temperature rise says less ice on the continents and therefore more water in the ocean. In addition, when its temperature increases, the water "swells" (thermal expansion phenomenon), which also contributes to sea level rise with global warming. During the Last Glacial Maximum, 20,000 years ago, sea level was 120 m lower than it is today [6]. Sea level reconstructions indicate rapid rates of sea level rise, up to 5 cm per year at the end of the glacial periods, and 1-2 cm per year during the interglacial periods.
Logically, since the end of the 19th century and the start of global warming, sea level has been rising continuously, whereas it had been relatively stable for the previous 3,000 years. Average sea level has risen by about 25 cm since 1880. Moreover, it is rising faster and faster: the rate of sea level rise was around 1 mm/year at the end of the 19th century; it was around 2 mm/year in the 20th century and would have reached 3.6 mm per year between 2006 and 2015 [6].
Source of the chart: NOAA [6].
Humans are changing sea level: the rate of sea level rise is accelerating
References
[1] H. Ritchie, M. Roser, et P. Rosado, « CO₂ and Greenhouse Gas Emissions », Our World in Data, 2020. https://ourworldindata.org/co2-and-greenhouse-gas-emissions
[2] Skeptial Science, « What does past climate change tell us about global warming? », Skeptical Science, 2020. https://skepticalscience.com/climate-change-little-ice-age-medieval-warm-period-intermediate.htm
[3] IPCC, 2021: Summary for Policymakers. In: Climate Change 2021: The Physical Science Basis. Contribution of Working Group I to the Sixth Assessment Report of the Intergovernmental Panel on Climate Change [Masson-Delmotte, V., P. Zhai, A. Pirani, S.L. Connors, C. Péan, S. Berger, N. Caud, Y. Chen, L. Goldfarb, M.I. Gomis, M. Huang, K. Leitzell, E. Lonnoy, J.B.R. Matthews, T.K. Maycock, T. Waterfield, O. Yelekçi, R. Yu, and B. Zhou (eds.)]. Cambridge University Press, Cambridge, United Kingdom and New York, NY, USA, pp. 3−32, doi:10.1017/9781009157896.001. https://www.ipcc.ch/report/ar6/wg1/chapter/summary-for-policymakers/
[4] R. Rohde, « Global Temperature Report for 2024 », Berkeley Earth, 2025. https://berkeleyearth.org/global-temperature-report-for-2024/
[5] Copernicus Climate Change Service (C3S) , « The 2024 Annual Climate Summary - Global Climate Highlights 2024 », 2025. https://climate.copernicus.eu/global-climate-highlights-2024
[6] NOAA, « Climate Change: Global Sea Level », NOAA, 2022. http://www.climate.gov/news-features/understanding-climate/climate-change-global-sea-level
[7] A. Buis, « Milankovitch (Orbital) Cycles and Their Role in Earth’s Climate – Climate Change: Vital Signs of the Planet », NASA, 2020. https://climate.nasa.gov/news/2948/milankovitch-orbital-cycles-and-their-role-in-earths-climate/