

Articles on the Anthropocene
In-depth articles on the Anthropocene
What are the indicators of the Anthropocene?
Let's discover the dashboard of our epoch and what it reveals: the Great Acceleration
The profusion of indicators is a notable feature of our times. In the age of "big data", everything can (and must) be measured and recorded. The quantity and quality of your sleep, your caloric intake and expenditure, your daily number of steps, your company's performance... The Anthropocene is no exception to the trend for indicators, and a "planetary dashboard" (or "Anthropocene dashboard") has even been developed to track crucial aspects of the trajectories of human activity and the Earth.
What is the Anthropocene dashboard ?
The International Geosphere-Biosphere Programme (IGBP) was conducted from 1987 to 2015 to study global change (http://www.igbp.net/). As part of this research program, 24 indicators were defined to describe the trajectories of human activity and the Earth over the last few centuries. These 24 indicators provide a detailed diagnosis of our times and form a dashboard of the Anthropocene.
The 24 indicators were first published in the IGBP synthesis in 2004, before being updated in a scientific publication released in 2015 [1]. They can be consulted on the IGBP website [2]. The indicators are divided into 2 main groups: 12 indicators to describe socio-economic trends and 12 indicators to describe Earth system trends.
All indicators are presented over a period running from 1750 to 2010. This enables to trace the evolution of human activity since the start of the industrial revolution and the resulting changes in the Earth system.
For most indicators, a clear inflection is observed from 1950 onwards, when the "Great Acceleration" began. The Anthropocene dashboard is thus known to display the "Great Acceleration graphs". Above all, the dashboard highlights what is an essential component of the Anthropocene: the Earth's trajectory is now closely linked to that of humanity.
The socio-economic trends
The 12 indicators of socio-economic trends are designed to reflect the main characteristics of contemporary society, including demographics, economic activity, resource use, urbanization, globalization, transportation and communication.
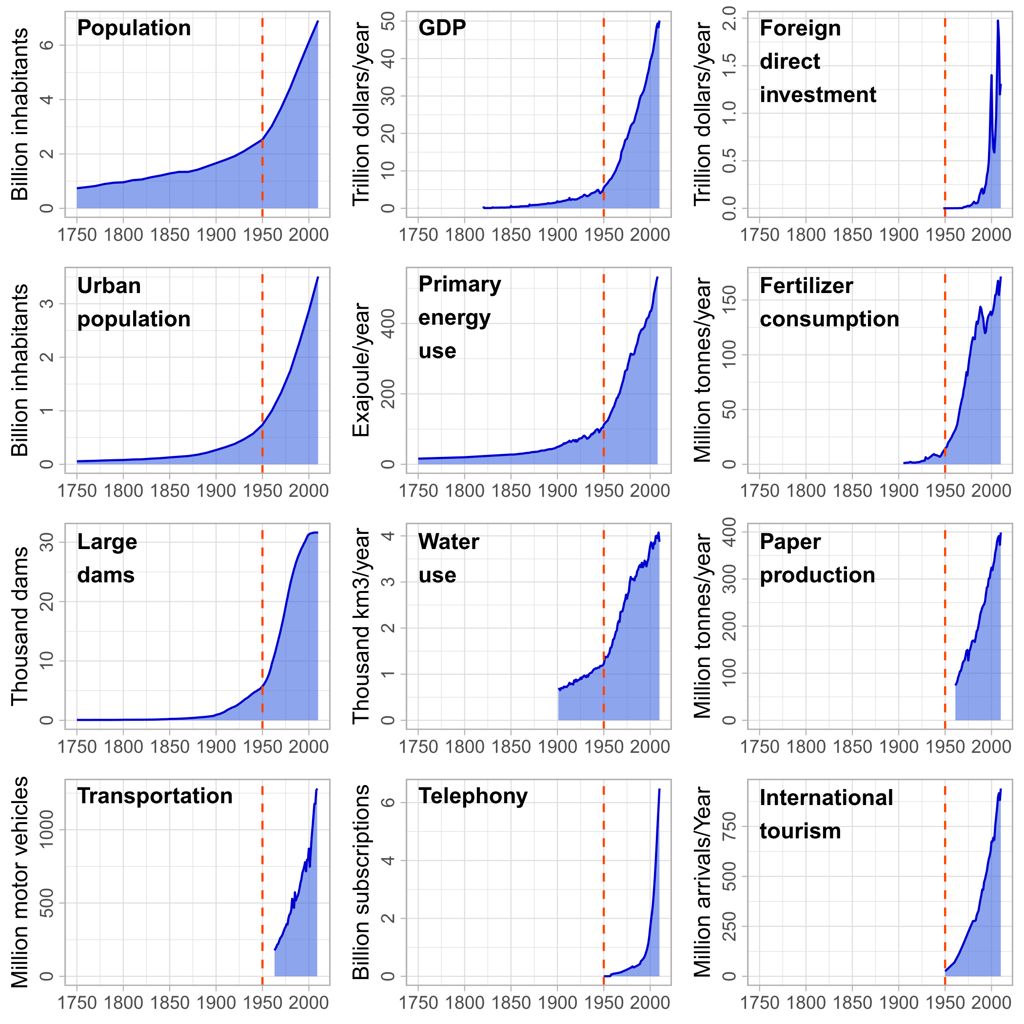
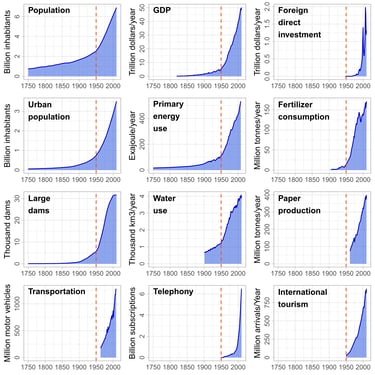
Figure 1: Graphs of the 12 indicators of socio-economic trends of the Anthropocene dashboard. Data source: IGBP (http://www.igbp.net/news/pressreleases/pressreleases/planetarydashboardshowsgreataccelerationinhumanactivitysince1950.5.950c2fa1495db7081eb42.html).
Overall, the 12 socio-economic indicators show the same trend: an impressive growth over the period studied (1750-2010), with a dramatic acceleration after the Second World War (1950, the start of the Great Acceleration). This development is unprecedented in the history of mankind. For example, in terms of population or GDP, the increase over the last half-century has been so strong that it overwhelms all previous variations.
The increase in human activity, as measured by demographic and economic growth, goes hand in hand with a steady rise in energy consumption, particularly energy from fossil fuels, which form the bedrock of our thermo-industrial civilization.
The combination of foreign direct investment, international tourism and telecommunications gives an idea of the degree of globalization and connectivity, which has increased considerably over the last few decades. Some indicators describe phenomena that simply didn't exist less than a century ago, and for which recent developments are particularly striking. Motor vehicles, telephones and international tourism, for example, were uncommon before 1950, but have since grown dramatically. This rise in the flow of people and data is totally linked to the increased use of (fossil) energy.
The Earth system trends
The 12 indicators of Earth system trend track changes in key features of the planet's structure and functioning, which are largely influenced by human activity: for example, atmospheric composition (greenhouse gas levels), the thickness of the ozone layer, the climate system (global surface temperature), biogeochemical cycles (water, nitrogen), marine (degree of ocean acidification) and terrestrial ecosystems (agricultural and tropical forest areas), and biodiversity.

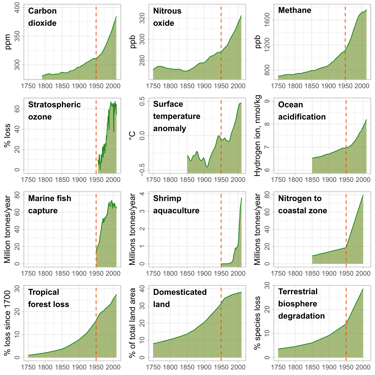
Figure 1: Graphs of the 12 indicators of Earth system trends of the Anthropocene dashboard. Data source: IGBP (http://www.igbp.net/news/pressreleases/pressreleases/planetarydashboardshowsgreataccelerationinhumanactivitysince1950.5.950c2fa1495db7081eb42.html).
Like the 12 socio-economic indicators, to which they are linked, the 12 Earth system indicators as a whole show strong growth over the period studied, and highlight the great acceleration from 1950 onwards: atmospheric greenhouse gas content, global surface temperature, ocean acidification, shrimp production (a proxy for coastal zone anthropization), nitrogen flows to the ocean, tropical forest loss and biosphere degradation all increased sharply over the period.
There are, however, some notable divergences from this overall trend. For example, in recent years, the quantities of marine fisheries have fallen due to the depletion of global marine fish stocks, but this has been offset by a very sharp increase in aquaculture [3].
The increase in agricultural land has been rather moderate since 1950, even though the period has been characterized by human population explosion. In fact, the increase in farmland has been mitigated by the intensification of agriculture, which enables producing more food on less land. However, this positive effect of intensive agriculture is accompanied by two terrible drawbacks: 1) massive use of fertilizers, which disrupt the nitrogen cycle and generate powerful greenhouse gases (nitrous oxide, N2O), and 2) immoderate use of pesticides, which contribute to environmental degradation and the sixth mass extinction of life on Earth.
Finally, after decades of depletion, the ozone layer has recently stabilized or even recovered. This dynamic is the result of measures (with "universal" adherence to the Montreal Protocol) taken to reduce emissions of chemical compounds (chlorofluorocarbons, halons, etc.) responsible for the destruction of stratospheric ozone [4].
If the problem of ozone depletion seems to be on the way to being resolved, it's certainly thanks to the widespread adoption of appropriate measures, but also because of the instability of the ozone-depleting substances: they rapidly disappear from the atmosphere as soon as we stop emitting them. In contrast, a gas such as CO2 is particularly stable and therefore has a very long residence time in the atmosphere. Which means that, contrary to what some might argue, solving the problem of the ozone layer is not a good example of how simply taking measures in good time will bring the climate back to "normal".
Global trends mask strong equity issues
All these global indicators should not obscure the fact that certain trends can be highly heterogeneous in space, as shown and discussed by Steffen et al [1]. For example, in the case of population or GDP, very strong growth was observed in the so-called "developed" countries before 1950, whereas this dynamic has only been at work for a few decades in the so-called "developing" countries, which later took the sacrosanct path of growth.
This "phase shift" is also particularly visible in greenhouse gas emissions (not shown in the dashboard, but which you can view here), for which European countries and the United States bear a crushing historical responsibility. However, while emissions are tending to stagnate or even decrease in these countries, they have been soaring for some years in "developing" countries, due to strong economic growth but also to the production of many consumer goods for the populations of "developed" countries, who have largely externalized the environmental disorders inherent in their lifestyles over time.
There are myriad indicators of the Anthropocene
The 24 indicators of the Anthropocene dashboard are highly complementary and already offer a very detailed diagnosis of our times. Comparing Earth system and socio-economic trends highlights the total interdependence between the evolution of humanity and that of the planet, with the Great Acceleration visible at all levels since 1950.
In theory, it's possible to imagine hundreds of indicators that would aptly demonstrate the Great Acceleration: for example, the number of McDonalds restaurants (proposed in the first version of the IGBP as a proxy for economic globalization), the number of videos viewable on YouTube, the amount of energy used by computers, the kilometers of paved roads, the quantity of pesticides used... However, building indicators requires sufficiently long data series, which is not always the case [1].
On this website, in addition to some IGBP indicators (which I have updated with the most recent data), I present a large number of key indicators of the Great Acceleration: life expectancy, infant mortality rate, share of population overweight, share of population in extreme poverty, share of population illiterate, productivity, plastic production, greenhouse gas emissions (in addition to their concentration in the atmosphere), sea level rise, species extinction rate, decline in animal populations...
I've also developed an application that allows consulting a number of indicators interactively, for example, by choosing the time range or region to be displayed.
Two leading indicators of human hegemony on Earth
To finish with the indicators, I'd like to mention two that illustrate particularly well the overwhelming role played by humans in life on Earth. The first is the share of humans and their livestock in mammal biomass. A few thousand years ago, before the birth of agriculture, humans (who did not raise animals) accounted for only a tiny proportion of mammal biomass [5]. Today, humans and the animals they raise account for over 96% of mammalian biomass [6]! The remaining crumbs (4%) correspond to wild animals.
The second indicator concerns the mass of what humans produce in relation to the mass of living organisms. The mass of everything produced by human activity is doubling every 20 years, and has passed in 2020 a symbolic threshold: the total biomass of our planet [7]. This means that humans, who account for 0.01% of the Earth's biomass [5], now alone produce more than the 99.99% of all living organisms! By way of comparison, in 1900, the mass of what humans produced represented just 3% of the planet's biomass [7].
Does the begining of the Great Acceleration mark the start date for the Anthropocene?
The planetary dashboard sheds light on two questions at the heart of debate on the Anthropocene: 1) Are the impacts of human activity significant enough to distinguish the present epoch from the Holocene? 2) And, if so, when did the Anthropocene begin?
As I explained in another article, human activity was able to profoundly and widely modify certain aspects of the Earth system long before the Industrial Revolution and the Great Acceleration (with, for example, the worldwide extinction of Pleistocene megafauna or deforestation in France). Nevertheless, the astonishing evolution of different indicators since the middle of the 20th century clearly shows that the Great Acceleration has taken us into another dimension.
For example, over the last 800,000 years, the concentration of CO2 in the atmosphere has never exceeded 300 ppm [8]. In 2022, after a few decades of industrial activity, it has reached nearly 420 ppm, compared with 280 ppm in 1850. In fact, many aspects of the Earth system have recently evolved far beyond the conditions known over the last tens, even hundreds of thousands of years. The current epoch is therefore clearly distinct from the Holocene and 1950, the start date of the Great Acceleration, is a relevant starting point for the Anthropocene.
In their 2015 article, Steffen et al. spoke along these lines, concluding that "only beyond the mid-20th century is there clear evidence for fundamental shifts in the state and functioning of the Earth system that are beyond the range of variability of the Holocene and driven by human activities. Thus, of all the candidates for a start date for the Anthropocene, the beginning of the Great Acceleration is by far the most convincing from an Earth system science perspective [1]."
What future for humanity and the Earth? - The Great Decoupling vs. the Great Collapse
The trends highlighted by the Anthropocene dashboard naturally beg the question: what does the future hold for humanity and the Earth? It is unreasonable to imagine that the curves presented can go on forever. Based on this logic, Steffen et al. concluded their article with two extreme evolutionary scenarios: the Great Decoupling or the Great Collapse [1].
The Great Decoupling scenario corresponds to the great ambition (the great illusion?) currently shared by a large number of people (politicians, economists, pro-technos...) who have no wish whatsoever to call into question human development as it has been thought for several centuries. In this scenario, economic activity continues to grow, but this growth takes place, oh miracle, without altering the Earth system. For example, GDP increases, but there are no more greenhouse gas emissions, so the level of greenhouse gases in the atmosphere stabilizes. The magic wand that suddenly makes it possible to produce-consume more while polluting less is called "cleantech" or "greentech".
The Great Collapse scenario is one in which the socio-economic and the Earth systems reach critical thresholds, tipping them into uncontrolled collapse logics. Collapse theory (collapsology) has been popularized by a number of recent books, particularly (in France) Comment tout peut s'effondrer by Pabo Servigne and Raphaël Stevens [9]. In the Great Collapse scenario, most of the indicators presented in the dashboard experience a sharp decline.
We can, of course, imagine an infinite number of possibilities between these two extremes, with a mix between decoupling and collapse. One of these mixed scenarios could be as follows: a decoupling (let's be crazy!) between economic growth and greenhouse gas emissions, but not between economic growth and biosphere degradation; in this case, the increase in GDP would take place without any increase in the level of greenhouse gases in the atmosphere, but with the continuation of the collapse of "non-human" living organisms already underway.
References
[1] W. Steffen, W. Broadgate, L. Deutsch, O. Gaffney, et C. Ludwig, « The trajectory of the Anthropocene: The Great Acceleration », Anthr. Rev., vol. 2, no 1, p. 81‑98, 2015. https://journals.sagepub.com/doi/10.1177/2053019614564785
[2] IGBP, « Planetary dashboard shows “Great Acceleration” in human activity since 1950 », IGBP. http://www.igbp.net/news/pressreleases/pressreleases/planetarydashboardshowsgreataccelerationinhumanactivitysince1950.5.950c2fa1495db7081eb42.html
[3] FAO, « The state of world fisheries and aquaculture 2022 », 2022. https://www.fao.org/documents/card/en?details=cc0461en
[4] L. M. Polvani et al., « No evidence of worsening Arctic springtime ozone losses over the 21st century », Nat. Commun., vol. 14, no 1, 2023. https://www.nature.com/articles/s41467-023-37134-3
[5] H. Ritchie, « Wild mammals make up only a few percent of the world’s mammals », Our World in Data. https://ourworldindata.org/wild-mammals-birds-biomass
[6] Y. M. Bar-On, R. Phillips, et R. Milo, « The biomass distribution on Earth », Proc. Natl. Acad. Sci., vol. 115, no 25, p. 6506‑6511, 2018. https://www.pnas.org/doi/full/10.1073/pnas.1711842115
[7] E. Elhacham, L. Ben-Uri, J. Grozovski, Y. M. Bar-On, et R. Milo, « Global human-made mass exceeds all living biomass », Nature, p. 1‑3, 2020. https://www.nature.com/articles/s41586-020-3010-5
[8] D. Lüthi et al., « High-resolution carbon dioxide concentration record 650,000–800,000 years before present », Nature, vol. 453, no 7193, 2008. https://www.nature.com/articles/nature06949
[9] P. Servigne et R. Stevens, Comment tout peut s’effondrer. Petit manuel de collapsologie à l’usage des générations présentes. Seuil, 2015.
Conclusion
The Anthropocene dashboard is a highly relevant tool for tracking the trajectories of human activity and the Earth, which are now interdependent. Its findings are unequivocal: all the indicators are turning orange, if not red. Humanity has certainly made spectacular progress over the last few centuries, but at the cost of terrible damage to the Earth system.
It seems to me that this alarming assessment calls for a profound reflection on our future: do we want to continue with the current development model, i.e. that of "always more" or "never enough", lulling ourselves into the illusion that consuming more can now be done without altering the planet's habitability? Is this stubbornness not, on the contrary, a one-way ticket to the great collapse? Wouldn't it be more reasonable to question our model and redefine what we call "development", so that it truly constitutes progress, not only for humans but also for the "non-humans" who populate this world with us? Time will tell, but I don't get the impression that we're on the road to redefining a collective horizon...
Henri Cuny